Volatility ETF junkies love 1.5x leveraged UVXY for its spikes. So what is reasonable to expect for a UVXY spike?

Never Trust Any Predictions
UVXY is one of the most complex financial products available to retail traders. Therefore, it is not surprising that most predictions are wrong for these reasons:
- The person making the prediction does not understand how UVXY works. Common mistakes include not knowing what UVXY tracks or how the leverage factor works.
- The predictor uses unrealistic inputs to determine their price target. Sensational price targets get eyeballs and clicks, so they are not in short supply. However, historical data can be helpful to validate forecast inputs.
Consequently, why don’t you learn yourself to predict how high UVXY can go?
How to Calculate UVXY Price Targets
We will explore first what UVXY tracks and then review historical data to validate inputs.
UVXY Pricing Formula
To understand how UVXY prices are determined, a thorough understand of how UVXY works is required. If you have not yet read this article, now is a good time!
Calculating the One-Month Blend
In a nutshell, UVXY tracks the daily returns of the one-month blend of first and second month VIX futures.
- Note that this one-month blend is not the same as VIX. UVXY does not track the VIX!
- To calculate the one-month blend, the latest quotes of first and second month VIX futures contracts are required. Reliable sources include VixCentral.com, Yahoo Finance or brokerage apps.
- In addition, the proportions of the first month contract and the second month contract must be known to calculate the one-month blend.
- Sophisticated traders have Excel spreadsheets, Python scripts or other tools to precisely calculate these proportions.
- The ProShares UVXY website shows the previous day’s holdings enabling an approximation. Just summarize the number of contracts (for example, 30 first month contracts and 70 second month = 100 contracts in total) and calculate the percentages.
- Alternatively, we can approximate the proportions by counting the number of calendar days to the nearest VIX futures expiration and multiplying by 3.33. For example, when you count 15 calendar days to expiration of the first month contract, the first month contract holdings should be approximately 15 * 3.33 = 50% of total assets.
- The final step is to calculate the one-month blend. Let’s assume VIX futures are quoted at 20 (first month) and 25 (second month), respectively. Furthermore, let’s assume 50% first month contracts and 50% second month contracts.
50% * 20 + 50% * 25 = 22.5
Calculating UVXY Returns
Once the current value of the one-month blend is available, we can calculate how high UVXY can go!
Let’s begin with an easy example. Let’s assume the one-month blend closed at 20 and UVXY at $10. We expect the one-month blend to go to 25 the next day. How high does UVXY go?
As we know, UVXY tracks the daily returns of the one-month blend of VIX futures and has a 1.5x leverage factor.
- The one-month blend moves from 20 to 25, i.e. +25%.
- Applying the 1.5x leverage factor yields +25 * 1.5 = +37.5%.
- UVXY moves from $10.00 to $10.00 * 1.375 = $13.75.
More realistic and difficult examples go beyond one-day horizons. Over longer time horizons, the net-asset-value of UVXY is affected by contango (and its opposite, backwardation) and leverage decay (beta slippage). Follow the links for examples how to calculate multi-day moves.
Historical Data
As established above, UVXY does not track spot VIX or the S&P 500, but it follows the daily returns of the one-month blend of VIX futures.
In order to come up with realistic inputs for UVXY predictions, historical data can provide meaningful insights.
Historical Data: VIX
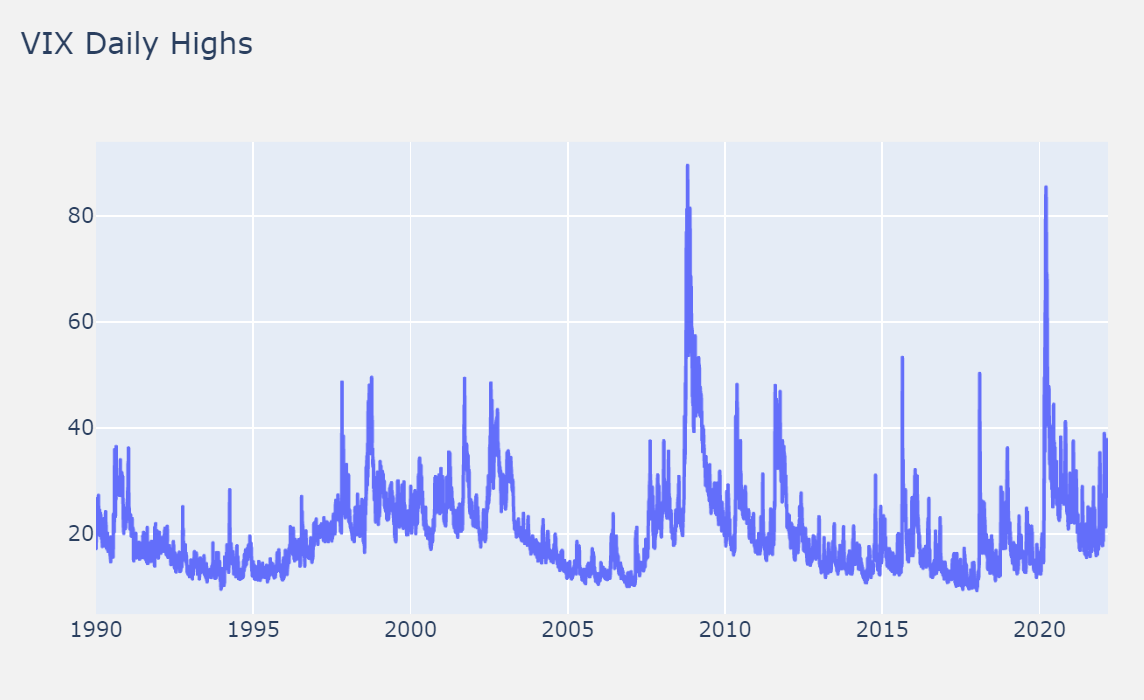
Unfortunately, VIX futures started trading only in March 2004. Therefore, we will study VIX spikes from 1990 through today, even though UVXY does not track VIX.
The chart below supports the following observations:
- VIX can go as high as 80 – 90.
- Major volatility events, such as the Global Financial Crisis in fall 2008 or the COVID-19 panic in February/March 2020, can propel VIX to these levels within a few weeks.
- It takes VIX much longer to normalize after these major volatility events. Note how slowly the VIX returned to the levels experienced prior to these two major events.
- There are eight medium volatility events when VIX reached around 50.
- These events were caused by economical or political issues (for example, recession in 2002, potential break-up of European Union in 2011).
- After many of these medium volatility events, VIX dropped much faster to its previous level.
Important to note: The VIX index has been around for a little more than three decades. Such a short time span does not allow to conclude that all future volatility events will behave in the same way. They can reach higher VIX levels. VIX can stay elevated for longer.
A real-life example is the Black Monday Crash in October 1987. On October 19, 1987, the Dow Jones fell 22.6%. The VIX did not exist at that time but later calculations (using a methodology slightly different from today’s VIX) suggested it would have reached 150.
Historical Data: One-Month Blend of VIX Futures
As mentioned above, the first VIX futures contracts began trading on March 26, 2004. This severely limits the availability of data.
However, the chart below shows some important characteristics.
- During non-volatile periods, the one-month VIX future (‘VIX_future_30’) is slightly above the VIX. This situation is “normal”, and futures traders refer to it as contango.
- During a spike, both the VIX and the one-month VIX future go up quickly. However, the one-month VIX future usually undershoots. Futures traders describe this situation as backwardation.
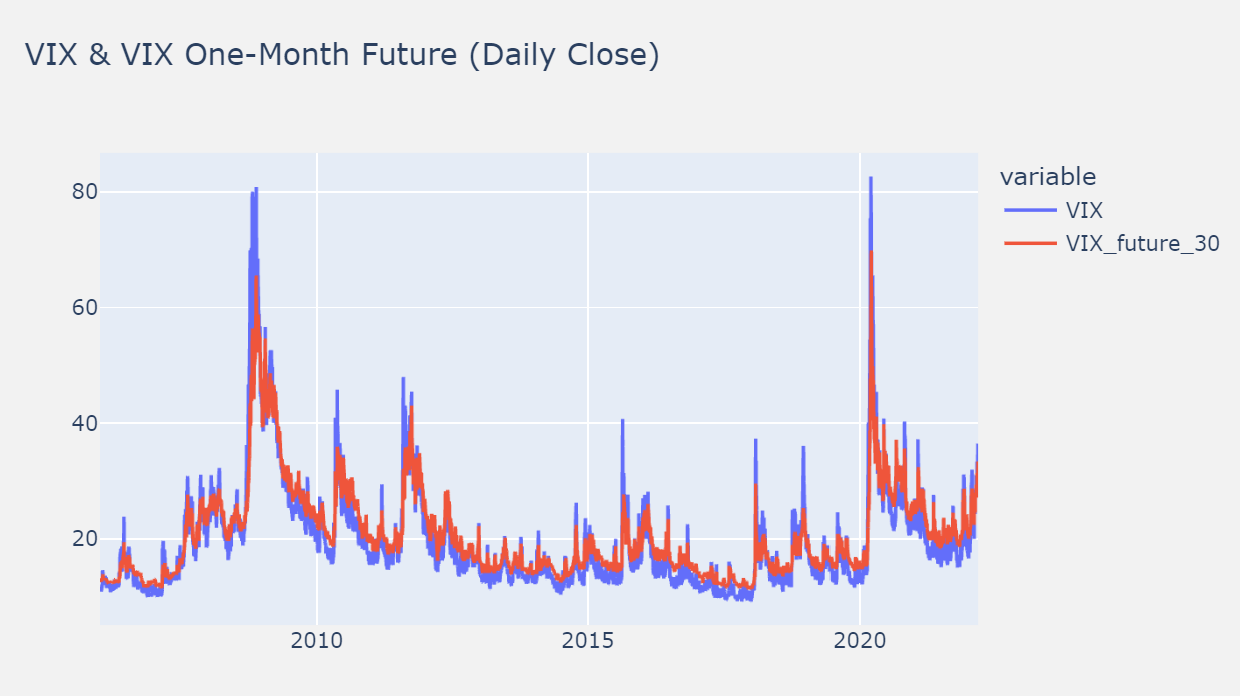
This leads to an important conclusion: The one-month VIX futures usually starts the spike at a higher level than VIX – and peaks at a lower level than VIX.
Ready to Calculate Your Own Prediction?
Trading without knowing where UVXY can go is a recipe for financial disaster, as this volatility ETF is a high-risk trade – both short and long.
It is heart-breaking to see how novice UVXY traders often lose money without understanding why.
Hopefully, this article (and all the others on this website) teaches traders how high or low UVXY can go.